Hi, my name is James and welcome to Code/Switch. Today I want to talk about lifespan. One day I will die, as will everyone around me. Both CGPGrey and Kurzgesagt both have done videos pretty recently about the morality surrounding human aging and death. Both videos are interesting, but its this video from Skunk Bear that I want to explore a bit today.
The video is safe for work, but it talks about an experiment done with an animal called a hydra to watch it die. The creature lived for years and are currently still alive at the ripe old age of 11. In the video the narrator cites that this old age breaks “a well known pattern in nature” where generally the sooner you produce young, the sooner you die. Now, the video never mentions the actual name of this pattern or theory and that bugged me, so I did some research and found that it is indeed a thing, but doesn’t actually have a name. This pattern was documented in the journal Evolutionary Ecology and written by two professors from the University of Utah, Salt Lake City; Eric L. Charnov & David Berrigan.
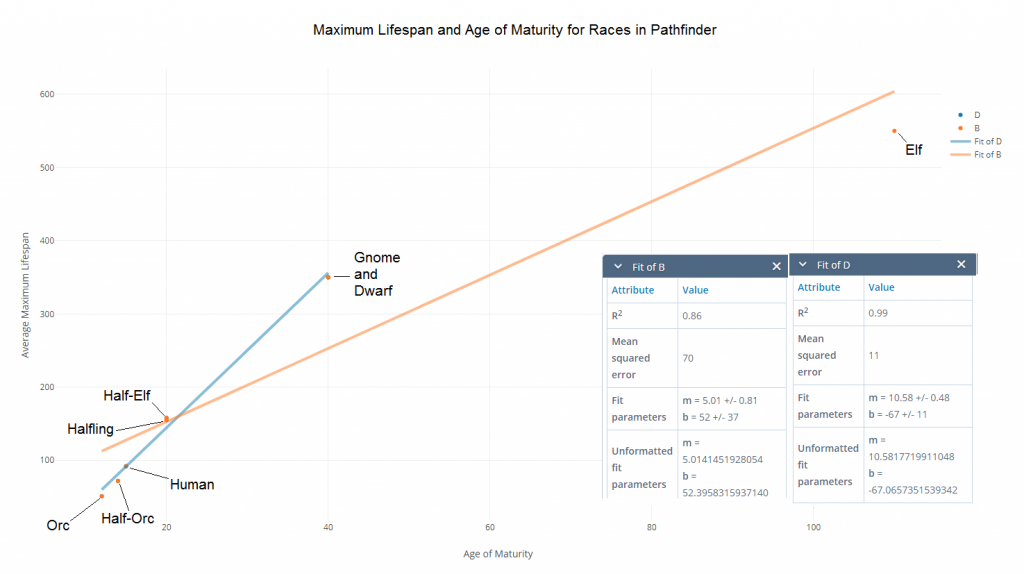
I did some research into this topic a bit, because I spend my free time in weird ways, ok? I learned that the closer the r2 value is to 1, the more likely the dataset is correct in its intent. I also learned this type of graph works best with creatures of similar types e.g, mammals & birds versus animals & plants, and that it also works better the further you categorize, i.e, simians & parrots work better than mammals and birds. Lastly, this type of data analysis is probably only good for estimation as exceptions greatly skew this data set. If you had a data set of rodents it’d have an r2 value of close to 1, but throw in the naked mole rat which can live up to 30 years versus the normal rats ~3 years and it’ll ruin all your data. Armed with this knowledge, I went ahead and figured I’d whip up a chart of Pathfinder core races plus orcs to demonstrate this pattern.
I purposely made two lines, one that takes elves into the data set (orange line) and one that excludes them (grey) to express that previously mentioned weirdness with outliers. In general the core races fall in with this natural pattern. The races along the grey line have an r2 value of .99, and their line has a slope of 10.32. Using this and the data points I used you could even estimate lifespan by just finding the age at which these creatures mature. (The data points are the maturity and average maximum lifespans from the Pathfinder Core Rulebook.) For instance if I find a new race that reaches maturity at 35, using the grey line I can estimate how high their maximum lifespan is.
Then come the elves. The elves ruin everything, their lifespan drags this graph way far away and decreases the slope of the line dramatically and ruins its r2 value. You may have been able to use the dataset to infer some connection to the other races as their rate of maturation and death are proportional, but thanks to the elves, you can take that idea and chuck it. Stupid sexy aliens!
Thank you for joining me today on Code/Switch, sometimes I do thought experiments to help me make sense of Golarion and the Golarion System. Sometimes I get great conclusions, other times I get things that fail. This is one of those, but in failure we learn, humanoid life on Golarion is different than life on Earth. Thank you for joining me on this adventure in fictional math and biology. If you have any questions about Pathfinders Golarion, Starfinders Golarion System, or how any RPG trope would work in meatspace, drop me a line in the comments or hit me up @James on the Know Direction Discord server.


This is SUPER cool. I’m gonna have to hit you up for more info on this topic for reasons….
I wanted this article to keep going for so much longer….